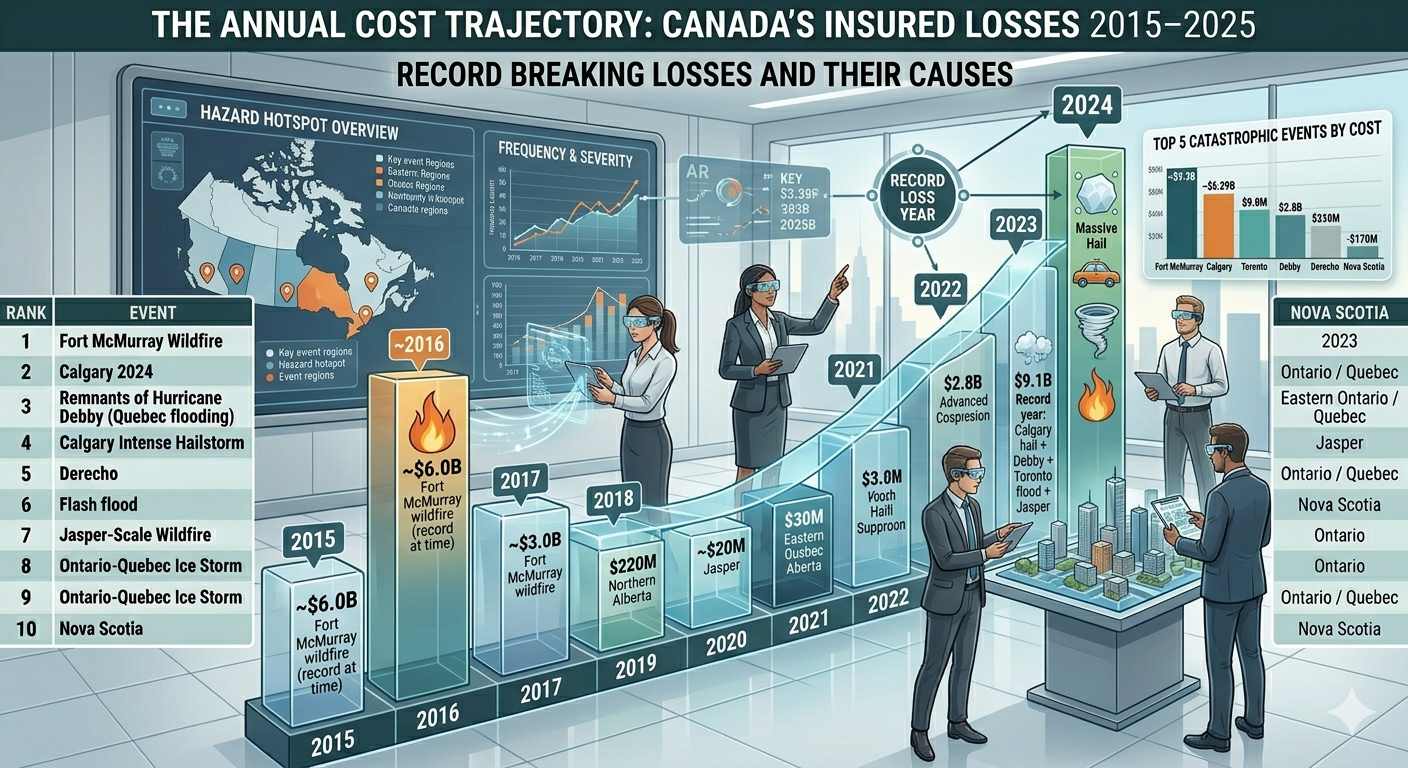
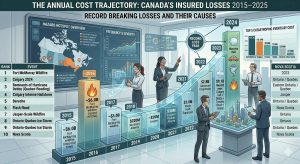
Canada just recorded two of the three most expensive years for weather-related insured losses in its entire history, back to back. In 2024, for the first time in Canadian history, insured damage caused by severe weather events surpassed $8 billion, shattering the previous record of $6 billion set during the Fort McMurray wildfires of 2016. Then 2025, while comparatively quieter, still delivered its own verdict: insured losses exceeded $2.4 billion in 2025, making it the tenth-costliest year on record for severe weather-related insured losses in Canada.
Read that again. A year with $2.4 billion in insured losses is now only the tenth-worst year on record. That is what the new baseline looks like.
Between 2006 and 2015, Canada’s total insured losses from catastrophic weather events and wildfires came to $14 billion over an entire decade. Between 2016 and 2025, that figure reached $37 billion, nearly tripling the previous decade. The average number of claims nearly doubled over the same period.
The Canada Storm Protection Index 2026 draws on data from the Insurance Bureau of Canada (IBC), CatIQ, Environment and Climate Change Canada (ECCC), the Canadian Climate Institute, Canada’s National Risk Profile, and multiple peer-reviewed studies to answer the question every Canadian resident, homebuyer, and emergency planner is now asking: which cities are genuinely safer, which are carrying catastrophic exposure, and, critically, which ones are actually prepared?
The Numbers That Define Canada’s New Storm Reality
Before ranking cities, the scale of what has changed in Canada demands direct attention.
In just two months, July and August 2024, four catastrophic weather events resulted in over $7 billion in insured losses and more than a quarter of a million insurance claims. That represents 50% more claims than Canadian insurers typically receive in an entire year.
Since 2019, Canada has experienced a 115% increase in the number of claims for personal property damage and a 485% increase in the costs for repairing and replacing personal property. That 485% figure, an almost sixfold increase in repair costs in six years, is not a product of inflation alone. It reflects a fundamental shift in the frequency and severity of weather events striking populated areas.
Canada has already warmed 1.7 degrees Celsius since 1948, faster than the global average. Nine of the ten costliest years for insured damages from extreme weather in Canada have occurred since 2011, adding up to more than $27 billion in insured losses.
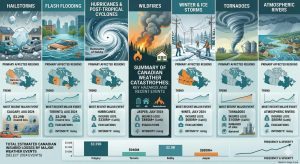
Canada Storm Risk Overview by Hazard Type
Understanding Canada’s storm risk requires understanding that the country faces five distinct threat categories, and different cities sit at the intersection of very different combinations of these threats.
The Cost of Canada’s Ten Worst Insured Weather Disasters (All-Time)
Context matters when evaluating city risk. The following table shows Canada’s costliest insured weather events on record, and the geography they concentrated in.
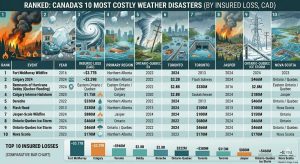
Sources: CatIQ, ECCC. All figures in Canadian dollars, not inflation-adjusted to single base year.
What this table makes immediately clear: Alberta and Ontario dominate Canada’s most expensive weather disasters. Of the ten costliest insured events on record, seven occurred in Alberta or Ontario, with Calgary appearing twice and Toronto twice.
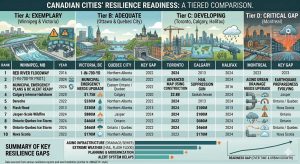
Part I – The Safest Canadian Cities From Storm Risk (2026 Rankings)
The following cities consistently score at the lowest end of combined storm risk, evaluated across hail exposure, flood risk, wildfire threat, hurricane/cyclone proximity, tornado frequency, and historical disaster cost per capita.
1. Victoria, British Columbia – Safety Score: 9.2 / 10
Victoria, BC, is the top climate-resilient city overall in Canada. Residents of Victoria are 72% less likely, on average, to be impacted by river flooding, and 83% less likely to face a drought, compared to other ranked Canadian cities.
Victoria’s position on Vancouver Island protects it from the tornado and hail exposure that defines Prairie risk. It sits outside the Atlantic hurricane belt and outside “Hailstorm Alley.” Its mild marine climate moderates winter storm severity. Its primary risks, earthquake and tsunami exposure along the Pacific Rim, are seismic, not storm-related, and therefore fall outside this Index’s scope. On pure storm protection metrics, it holds the top position.
Primary hazards: Atmospheric river rainfall events, occasional windstorms, earthquake risk (seismic, not storm) Why it scores well: Lowest river flood risk of any ranked Canadian city; minimal hail exposure; no tornado history; protected from Atlantic systems
2. Quebec City, Quebec Safety Score: 8.8 / 10
Quebec City combines an inland position with river proximity in a way that unlike Toronto or Montreal has historically avoided the worst flooding scenarios. Quebec City is among the top five most climate-resilient cities in Canada, alongside Victoria, Vancouver, Kelowna, and Ottawa, with proximity to water providing a protective climate factor against drought and water stress.
The city sits far enough north that most Atlantic tropical systems have weakened substantially before reaching it. Its dense urban core has historically managed stormwater better than many comparable-sized Ontario cities. Winter storms are frequent but predictable and well-managed by infrastructure built for the region’s climate.
Primary hazards: Spring flooding from the St. Lawrence, heavy snowfall, winter ice storms Why it scores well: Minimal tornado risk; low hail exposure; no hurricane direct-strike history; strong winter storm preparedness culture
3. Ottawa, Ontario – Safety Score: 8.5 / 10
Ottawa’s position earns it a high safety ranking despite being in a province that has produced two of Canada’s ten costliest disasters (the 2022 Ontario-Quebec derecho and the 2024 Toronto flooding events). Ottawa sits far enough from the lake-effect corridors and post-tropical storm tracks that concentrate the worst Ontario damage. Ottawa is among the five most climate-resilient major Canadian cities.
The caveat for Ottawa is real: remnants of Tropical Storm Debby, on August 9, 2024, delivered 80 to 120 millimetres of rain across the National Capital Region, creating torrents of water that damaged roads and flooded hundreds of basements in West Carleton. The event was a reminder that Ottawa is not immune but its historical damage profile remains significantly lower than Toronto, Montreal, or any Alberta city.
Primary hazards: Post-tropical remnant flooding, spring ice jam flooding on the Ottawa River, ice storms Why it scores well: No hailstorm alley exposure; inland buffer from Atlantic systems; lower density than Toronto reduces flash flood risk
4. Saskatoon, Saskatchewan Safety Score: 8.3 / 10
Saskatchewan consistently ranks as one of the least earthquake-prone provinces, with low wildfire risk relative to BC and Alberta, and no hurricane exposure. The least likely places to experience earthquakes in Canada are Saskatchewan and Manitoba. The least likely places to experience tornadoes are British Columbia, the Maritimes, Northern Canada, and places that lie in the northern shadow of the Great Lakes.
Saskatoon has a flat, open geography that prevents the terrain-driven flash flooding that devastates hillside and valley communities. Prairie severe weather hail and thunderstorms is the primary concern, but the city lacks Calgary’s specific position in Hailstorm Alley.
Primary hazards: Prairie thunderstorms, occasional hail, blizzards, spring flooding from the South Saskatchewan River Why it scores well: No Hailstorm Alley position; no Atlantic or Pacific storm exposure; low wildfire risk for a Prairie city
5. Winnipeg, Manitoba Safety Score: 8.1 / 10
Winnipeg’s primary natural disaster risk is spring flooding from the Red River, an acknowledged and long-managed threat. The city’s extensive Red River Floodway, completed in 1968 and expanded in 2006 to protect up to a 1-in-700-year flood event, represents one of the most significant flood infrastructure investments in Canadian history. Because that risk is managed rather than unmanaged, it scores better than cities with equivalent exposure but fewer defenses.
Primary hazards: Red River spring flooding, Prairie thunderstorms, extreme winter cold, occasional tornado Why it scores well: Comprehensive floodway infrastructure; no wildfire proximity; no hail alley exposure; no Atlantic storm track
Part II The Most Storm-Prone Canadian Cities (2026 Rankings)
1. Calgary, Alberta Risk Score: 9.7 / 10
The data on Calgary is unambiguous. Calgary is exceptionally vulnerable to damaging storms, earning it the nickname of the hailstorm capital of Canada. The hailstorm of August 5, 2024, arrived just over four years after another devastating billion-dollar hailstorm in June 2020. Insured losses from hail events in Alberta have totalled over $5.5 billion in the past five years alone.
The August 2024 Calgary hailstorm produced baseball-sized hail that punched holes in vinyl siding, broke windows, severely damaged roofs including that of Calgary International Airport and resulted in more than 130,000 insurance claims. The final CatIQ loss estimate reached CAD $3.29 billion. That figure makes it the second-costliest insured weather event in Canadian history, behind only the 2016 Fort McMurray wildfire.
Hailstorm Alley stretches from High River in southern Alberta northward through Calgary, through Red Deer to Lacombe and sometimes as far north as Edmonton, and is known as one of the worst areas in the world for damaging hail produced by thunderstorms.
Primary threats: Catastrophic hailstorms, severe thunderstorms, flash flooding from Bow River, urban heat amplification Historical cost: $3.29B (2024 hailstorm) + $1.2B (2020 hailstorm) + $880M (nearby Jasper wildfire 2024) = $5.37B in three years
2. Toronto, Ontario Risk Score: 9.2 / 10
Toronto holds a unique position in Canada’s storm risk landscape: it is the country’s most densely populated city placed in one of its most storm-vulnerable geographic corridors. Four of the five least climate-resilient major Canadian cities are located along Lake Ontario: Hamilton, Oshawa, St. Catharines, and Toronto. Ontarians in these cities are twice as likely to be impacted by riverine floods than the overall average across all 20 Canadian cities ranked.
Toronto has now produced two of the most expensive single-storm urban flooding events in Canadian history, the 2013 flash flood and the July 2024 flash flood, each approaching or exceeding $940 million in insured losses. In August 2024, thunderstorms bringing torrential rain moved into Mississauga and parts of Toronto. Roads and basements were flooded across the region, with numerous people requiring rescue from stranded vehicles. Toronto Pearson International Airport received a record-breaking 128.3 millimetres of rain in a single day, temporarily grounding flights.
In 2024, the Greater Toronto Area experienced one of the wettest summers in recent memory. June and July brought over 300 millimetres of rain nearly triple the usual amount. During the intense July and August 2024 thunderstorms, rainfall rates at some locations reached an extreme 50 to 80 millimetres per hour. That kind of downpour can quickly overwhelm drainage systems and rivers to trigger flash flooding with little warning.
Primary threats: Flash flooding, post-tropical cyclone remnants, severe thunderstorms, lake-effect snow, ice storms Historical cost: $940M (2024 flooding) + $940M (2013 flooding) + Ontario-Quebec derecho damage = $2B+ in flash flood events alone
3. Montreal, Quebec Risk Score: 8.9 / 10
Montreal’s storm risk is driven by its dual exposure: significant post-tropical remnant flooding from Atlantic systems that track northward, and an aging urban infrastructure that struggles with increasingly intense rainfall events. The August 9, 2024, flooding across southern Quebec became the province’s costliest weather disaster, with insured damages reaching an estimated $2.5 billion. The system arrived in central Canada after transitioning from a post-tropical low, delivering heavy downpours on and off throughout the day. More than 1,000 homes were flooded across southern Quebec. Flash floods damaged 170 roads. Wind gusts as high as 95 km/h swept through the region, cutting power to 550,000 customers.
The Quebec event surpassed the infamous 1998 ice storm to become the costliest insured weather event in the province’s history in a single August day. Montreal also faces regular ice storm exposure in winter and a growing urban heat island effect that amplifies severe thunderstorm formation over the city in summer.
Primary threats: Post-tropical cyclone flooding, ice storms, severe thunderstorms, flash flooding from urban intensity Historical cost: $2.8B from Hurricane Debby remnants (2024), previously $2.5B from same event across greater Quebec
4. Halifax, Nova Scotia Risk Score: 8.6 / 10
Halifax holds the most direct Atlantic hurricane and post-tropical storm exposure of any major Canadian city. It sits on a peninsula surrounded by water on three sides, sits at sea level in several key districts, and lies directly in the path of Atlantic tropical systems as they track northeastward. In Atlantic Canada, climate change is making hurricanes more frequent and more powerful.
Post-Tropical Storm Dorian struck Halifax in September 2019 as the strongest extratropical system to hit Nova Scotia since Hurricane Juan in 2003, cutting power to roughly 400,000 customers and causing extensive tree damage and coastal flooding. The 2023 Nova Scotia wildfires which struck unusually close to the city added a new threat dimension to the Halifax risk profile that did not exist in prior decades. Evidence suggests that Canadian tornado and severe wind hotspots are shifting eastwards, a worrying trend that would increase risks for densely populated parts of Ontario and Quebec, and Atlantic Canada.
Primary threats: Direct hurricane and post-tropical storm landfalls, coastal storm surge, extreme rainfall, nor’easters, wildfire (emerging) Why it ranks high-risk: Only major Canadian city with repeated direct-strike Atlantic tropical system history
5. Edmonton, Alberta Risk Score: 8.1 / 10
Edmonton sits at the northern edge of Hailstorm Alley and carries significant severe thunderstorm and tornado risk including the deadliest tornado in modern Canadian history, the 1987 Black Friday F4 tornado that killed 27 people and caused over $330 million in damage. On July 31, 1987, the Black Friday Edmonton F4 tornado was produced by the same system that generated 12–15cm hailstones in Spruce Grove and Edmonton.
Edmonton also faces wildfire smoke exposure from surrounding boreal forests and is one of the closest major cities to Fort McMurray, which suffered Canada’s costliest single disaster the 2016 wildfire just 465 kilometres to the north. The city’s position at the northern edge of Alberta’s severe storm zone creates a compounding risk profile distinct from Calgary’s more concentrated hail exposure.
Primary threats: Severe thunderstorms, hail, tornadoes, wildfire smoke, extreme cold events Historical cost: 1987 F4 tornado $330M+ (inflation-adjusted); ongoing severe weather losses as part of Alberta’s Hailstorm Alley
Part III Storm Protection Readiness Rankings
Canada’s National Risk Profile identifies emergency management capability as a critical variable in determining disaster impact and the gap between cities’ risk levels and their actual readiness is this year’s most important finding.
Key Findings: What the 2026 Index Tells Us
Finding 1: Alberta is Canada’s most expensive storm geography and the gap is widening.
Alberta’s Hailstorm Alley has now produced the first and second-costliest insured events in Canadian history (Fort McMurray wildfire 2016; Calgary hailstorm 2024). Calgary has experienced a number of severe storms featuring extensive hail damage in recent years, with especially severe events in 2020 and 2024, which together generated nearly $4.5 billion in insured losses. As the footprint of Calgary continues to expand, what was once a rural area becomes urban, and more people are exposed to severe weather impacts including destructive hailstorms.
Finding 2: The insurance cost acceleration is unlike anything in Canadian history.
Since 2019, Canada has experienced a 115% increase in claims for personal property damage and a 485% increase in costs for repairing and replacing personal property. , The President and CEO of the Insurance Bureau of Canada, Celyeste Power, stated plainly: “Canada is clearly becoming a riskier place to live, work and insure.” Finding 3: Tornadoes are shifting east toward the most densely populated provinces.
Experts have estimated that approximately 230 tornadoes occur in Canada each year, though only around 60 are formally confirmed, with most occurring in Southern Ontario, the southern Canadian Prairies, and southern Quebec. Canada ranks second in the world for the number of tornadoes per year. And critically, some evidence has suggested that Canadian tornado and severe wind hotspots are shifting eastwards a worrying trend that would increase risks for densely populated parts of Ontario and Quebec.
Finding 4: Severe storms are expected to become more frequent with every degree of warming.
Favourable conditions for the development of severe convective storms are expected to increase by 5 to 20 percent for each degree Celsius of global warming. In southern Alberta, hailstorms are expected to become more frequent and severe due to climate change. Canada has already warmed 1.7°C since 1948. Projections suggest further warming of 1.5 to 3°C by mid-century under current trajectories.
Finding 5: The readiness gap is a policy failure, not a knowledge failure.
The IBC’s Vice-President Craig Stewart stated that insurers are now paying out more in claims for a single event than the $1.9 billion that the federal government has allocated to climate adaptation over the past decade. “Canada needs to get ready for the next disaster. This is not the time for finger pointing this is the time for governments and the private sector to work together.
The compound average growth rate of insured losses from 2015 to 2024 is approximately 25% per year. At that rate, a single year’s insured losses in the early 2030s could routinely exceed $15 to $20 billion.
What Every Canadian Household Should Do Before the Next Event
- Identify your flood zone and know your city’s specific threats. Canada’s National Flood Map is publicly available through Natural Resources Canada. Enter your address. Do not assume you are safe because you have never flooded before the 2024 Quebec and Ontario events affected communities with no prior flood history.
- Review your home insurance policy for overland flooding coverage. Standard home insurance in Canada has historically excluded overland flood damage. Flooding is Canada’s most common and costliest disaster, causing approximately $1.5 billion in household, property, and infrastructure damages annually. Residential property owners bear approximately 75% of uninsured losses each year. Ask your insurer specifically about overland flood endorsements.
- If you live in Alberta especially Calgary invest in hail-resilient roofing and siding. The 2024 hailstorm damaged an estimated 35,000 buildings across northern Calgary, with damages ranging from dented roofs to the complete loss of windows and siding on some walls. Class 4 impact-resistant roofing materials can reduce hail damage dramatically and often qualify for insurance discounts.
- Sign up for Alert Ready and your municipality’s emergency notification system. Environment and Climate Change Canada’s Alert Ready system broadcasts warnings via wireless public alerting. Additionally, verify registration in your municipal emergency notification program, many require explicit opt-in and are separate from Alert Ready.
- Build a 72-hour emergency kit. Public Safety Canada recommends every household maintain enough supplies for at least 72 hours without external assistance: water (2 litres per person per day), non-perishable food, a battery-powered radio, flashlight, first aid kit, and copies of key identification and insurance documents in a waterproof container.
- Understand that your municipality’s stormwater infrastructure was not built for today’s rainfall intensity. Toronto’s July 2024 flooding was not an anomaly, it was the second time in eleven years the city recorded a near-$1-billion flood event. Rainfall rates during the 2024 Toronto summer storms reached 50 to 80 millimetres per hour at some locations far beyond what most municipal drainage systems were engineered to handle. In a heavy rain event, move vehicles off low-lying streets and avoid underpasses and ravines.
Index Methodology

City Safety Scores and Risk Scores are composite indices scaled 0–10 and should be read as relative rankings within the Canadian context, not as absolute predictors of disaster occurrence.
Final Assessment
Canada’s storm protection picture in 2026 is complex, honest, and urgent. Victoria and Quebec City are genuinely lower-risk environments. Winnipeg’s flood infrastructure is a legitimate example of how engineering investment can manage a high-risk geography. Ottawa’s combination of geography and federal emergency resources provides real advantages.
But the trajectory is not favorable for Canada’s most populated storm corridors. Calgary has now produced two of the top three most expensive insured disasters in the country’s history separated by four years. Toronto has flooded catastrophically twice in eleven years with no fundamental change in its stormwater infrastructure capacity. Montreal recorded its worst-ever insured weather event in 2024.
The IBC’s president stated in early 2026: “This shift demands that we fundamentally rethink how we build, plan and restore communities across our country. The best way to keep communities safe and insurance widely available and affordable is to invest seriously in resilience now.
The Canada Storm Protection Index asks the same question each year: are the cities that are building the most building the most resiliently? Based on this year’s data, the honest answer is still not consistently, not fast enough, and not everywhere it matters most.