Trends, Risks, and Prevention Strategies for Businesses in the United States and Canada
Executive Summary
Commercial burglary remains one of the most costly and disruptive crimes affecting businesses across North America. In 2026, business owners face a threat landscape shaped by persistent economic pressure, evolving criminal tactics, and uneven adoption of modern physical security measures.
This report synthesizes data from the FBI Uniform Crime Reporting (UCR) program, Statistics Canada, insurance industry loss reports, and retail security research to provide business owners, property managers, and security professionals with a clear, evidence-based picture of the commercial break-in risk environment.
Key findings from this report:
- Commercial burglaries account for roughly 35 to 40 percent of all reported burglary offenses in the United States annually, with losses averaging between $3,000 and $8,000 per incident when property damage and inventory loss are combined.
- Smash-and-grab attacks on storefronts have increased in frequency across major urban corridors, with glass storefront doors and windows remaining the most common entry point.
- Businesses without physical barrier security, such as security shutters or reinforced storefront systems, experience significantly higher rates of successful forced entry compared to those with layered physical protection.
- Retail stores, pharmacies, and convenience stores consistently rank as the highest-risk commercial property types.
- The average time for a commercial break-in is under four minutes, making physical delay mechanisms a critical component of any protection strategy.
This report is intended as an educational resource. It does not constitute legal or insurance advice.
Commercial Break-In Statistics in 2026
The Scale of the Problem
According to FBI crime data, burglary, defined as unlawful entry into a structure with the intent to commit a crime, has historically accounted for between 1.1 and 1.4 million reported incidents per year in the United States. Commercial properties, including retail establishments, offices, warehouses, and service businesses, account for approximately 35 to 40 percent of that total, suggesting roughly 385,000 to 560,000 commercial burglaries occur annually in the US.
In Canada, Statistics Canada’s Uniform Crime Reporting Survey tracks break-and-enter offenses separately for residential and commercial premises. Commercial break-ins have represented between 30 and 38 percent of all reported break-and-enter incidents in recent years, with roughly 55,000 to 75,000 commercial incidents reported annually, a figure widely understood to undercount actual events due to underreporting.
Year-Over-Year Trends
The long-term trend in reported burglary rates across North America declined steadily from the early 1990s through the mid-2010s. However, several factors have complicated that downward trajectory since 2020:
- Economic disruption following the pandemic period contributed to elevated property crime rates in certain metro areas.
- Organized retail crime (ORC) has grown as a distinct category, with coordinated smash-and-grab operations targeting high-value merchandise at scale.
- Post-pandemic business landscape shifts, including more vacancies, reduced foot traffic during off-hours, and staffing shortages affecting monitored security, have created new vulnerabilities.
The net result in many cities is that while overall burglary rates remain below their historical peaks, commercial break-ins in specific retail corridors and business districts have increased in both frequency and brazenness.
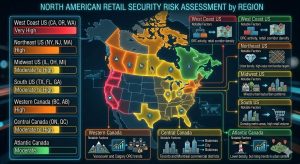
Break-Ins by Region
Risk is not evenly distributed across North America. Urban areas with dense retail concentrations, high foot traffic, and active organized crime networks experience disproportionately high rates of commercial break-ins. Key regional patterns include:
Break-Ins by Business Type
Not all commercial properties face equal risk. The nature of the business, what it sells, its hours of operation, its physical layout, and its typical cash or merchandise holdings, heavily influences criminal targeting decisions.
Most Targeted Business Types
Criminals target businesses where the perceived reward is high relative to the perceived risk and effort of entry. Research from insurance industry loss data and retail crime studies consistently identifies the following business categories as most frequently victimized.
Retail Stores
General retail, particularly electronics, clothing, and jewelry, represents the most frequently targeted commercial category. High merchandise density, predictable inventory, and easy resale value make retail stores attractive. Smash-and-grab tactics are disproportionately common here.
Risk level: Very High
Convenience Stores and Gas Stations
Extended hours, cash handling, and relatively modest physical security infrastructure make convenience stores and gas stations consistent targets. Many operate with limited overnight staffing, reducing the perceived risk for intruders.
Risk level: Very High
Pharmacies
The presence of controlled substances and medications with street value makes pharmacies a high-priority target for organized criminal operations. Pharmacy break-ins often involve rapid, violent forced entry designed to overwhelm any alarm response time.
Risk level: High
Restaurants and Food Service
Restaurants face dual risk: cash on premises after close, and relatively accessible points of entry including service doors, kitchen windows, and rooftop HVAC access. After-hours break-ins targeting cash drawers and point-of-sale systems are common.
Risk level: Moderate to High
Warehouses and Distribution Facilities
Warehouses hold high volumes of goods with significant resale value, electronics, tools, appliances, and consumer products. Their typically remote locations, minimal after-hours foot traffic, and large perimeters make perimeter monitoring challenging.
Risk level: Moderate to High
Professional Offices
Law firms, medical offices, dental practices, and financial services offices are targeted for equipment (computers, medical devices), data storage media, and cash. Break-ins to professional offices often go undetected until the following business day.
Risk level: Moderate
Liquor Stores
High per-unit merchandise value, ease of resale, and predictable inventory placement make liquor stores disproportionately targeted relative to their number. Many experience repeat victimization.
Risk level: High
Most Common Entry Points for Commercial Break-Ins
Understanding where criminals enter is foundational to effective prevention. Physical security assessments consistently identify the same vulnerabilities across commercial property types.
1. Glass Storefront Doors and Windows
Glass remains the single most exploited vulnerability in commercial security. Storefront-facing glass, whether in doors, sidelights, or display windows, can be broken in seconds with minimal tools. The smash-and-grab model depends almost entirely on this vulnerability.
Why it is exploited: Glass provides no meaningful physical resistance. Standard commercial glass panels can be breached with a common center punch, hammer, or even a heavy object thrown at speed. Once glass is broken, entry is immediate.
2. Rear Service Doors
Rear and side service doors are frequently the target of forced entry attacks. These doors are often less visible from the street, face alleys or parking lots rather than pedestrian areas, and may receive less maintenance attention, including aging locks, worn frames, and inadequate lighting.
Why it is exploited: Reduced visibility means more time for forced entry without detection. Many rear doors have weaker hardware than front entrances.
3. Side Entrances and Secondary Doors
Side entrance doors, particularly in strip mall or multi-tenant configurations, often sit in shadow zones between security camera fields of view. Criminals conduct reconnaissance to identify these gaps.
4. Windows
Ground-floor windows, particularly those not facing primary street traffic, are a common secondary entry point. Many commercial properties secure their primary entrance but leave windows with only standard glass and latching hardware.
5. Roof Access
Roof-based entry is less common but disproportionately effective for high-value targets like pharmacies and electronics retailers. HVAC openings, skylights, and rooftop access doors are potential entry points that many security assessments overlook.
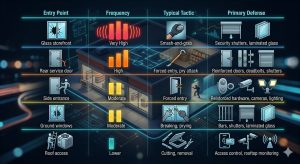
Most Common Break-In Methods
Smash-and-Grab
Smash-and-grab is the dominant tactic for retail-focused break-ins. A criminal or group breaks glass, typically a storefront window or door, grabs visible high-value merchandise, and exits within 60 to 90 seconds. Speed is the defining characteristic. The entire operation is often completed before any alarm response can arrive.
Trend: Organized smash-and-grab operations involving multiple individuals and vehicles have increased in frequency across major US and Canadian cities. These coordinated attacks move too quickly for traditional alarm-response models to interrupt.
Defense: Physical barriers that cannot be broken in under four to six minutes, such as roll shutters or security shutters, directly counter this tactic. If forced entry takes longer than the criminal’s risk tolerance, the target is typically abandoned.
Forced Entry Through Doors
Kicking in doors, prying door frames, attacking hinges, or applying mechanical force to locks accounts for a significant portion of after-hours commercial break-ins. This method is slower than smash-and-grab but more discreet than breaking glass.
Defense: Reinforced door frames, heavy-gauge steel doors, multi-point locking systems, and security shutters over door openings all increase the time and effort required.
Lock Picking and Bypass
Skilled criminals may pick or bypass locks rather than destroying them, allowing entry without obvious signs of forced entry. This is more common in targeted crimes, situations where a specific business is chosen for a specific reason, than in opportunistic break-ins.
Defense: High-security lock cylinders, keyless access control systems, and alarm systems with immediate response protocols.
Vehicle Ramming
Vehicle ramming, driving a car or truck into a storefront to create rapid, large-scale access, is a high-visibility tactic used primarily in organized retail crime targeting ATMs, safes, or high-value merchandise. Incidents have been documented across major cities in California, Ontario, and British Columbia.
Defense: Bollards, reinforced curbing, and heavy physical barriers at storefronts. Some jurisdictions now require anti-ram bollard installations for certain high-risk business categories.
After-Hours Perimeter Entry
Patient criminals may test perimeters methodically, checking for unlocked doors, probing for alarm system gaps, or identifying points of entry that avoid detection. This approach is more common in commercial districts with poor lighting and low overnight pedestrian traffic.
Defense: Layered alarm coverage, motion-activated lighting, and eliminating perimeter blind spots through camera placement.
Financial Impact of Commercial Break-Ins
The direct and indirect costs of a commercial break-in extend well beyond the value of stolen merchandise.
Direct Costs
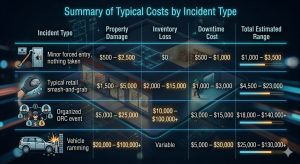
Property damage is consistently one of the largest immediate costs. Broken glass, damaged door frames, compromised security systems, and structural repairs after vehicle ramming events can run from $1,500 for a single broken window to $25,000 or more for serious structural damage.
Inventory loss varies widely by business type. A convenience store break-in may result in $500 to $3,000 in stolen goods. A pharmacy or electronics retailer may lose $20,000 to $100,000 or more in a single organized event.
Cash loss adds to direct costs for businesses that maintain on-site cash after hours.
Indirect Costs
Business downtime the period during which a business cannot operate while damage is assessed, repairs are made, and insurance processes beginc, represents significant lost revenue. Even a one-day closure can cost a small retailer $2,000 to $10,000 in lost sales.
Insurance deductibles typically range from $1,000 to $5,000 for commercial property policies, meaning most small-scale break-ins result in out-of-pocket costs regardless of coverage.
Insurance premium increases following a claim can add $500 to $3,000 annually to policy costs for several years.
Staff time and psychological impact, the disruption to employees, the time spent dealing with police, insurance adjusters, and contractors, represents real but harder-to-quantify costs.
Reputation and customer confidence can be affected in businesses where a break-in becomes publicly known, particularly in retail environments where customers may feel unsafe.
Commercial Break-In Trends by City and Region
United States
Los Angeles, California has been at the center of organized retail crime reporting in recent years. Coordinated smash-and-grab attacks on luxury retailers, electronics stores, and pharmacies have been extensively documented. The density of high-value retail targets combined with active ORC networks makes LA one of the highest-risk environments for commercial break-ins in North America.
Chicago, Illinois experiences elevated commercial burglary rates in both its dense commercial corridors and suburban retail strips. Convenience stores and smaller retailers in transitional neighborhoods face particularly high repeat-victimization rates.
New York City, New York presents a complex picture. While overall crime rates have fluctuated, commercial burglary in certain retail districts, particularly in outer boroughs and neighborhoods with high retail density but lower overnight security presence, remains a persistent concern.
Houston and Dallas, Texas have seen rising commercial break-in activity tracking with population and retail growth in the metro areas. Warehouse facilities and distribution centers face elevated risk.
Seattle, Washington has experienced significant retail crime pressure, with storefront break-ins in retail districts documented extensively by local business associations.
Canada
Vancouver, British Columbia has been the focus of substantial reporting on commercial break-ins, particularly in the downtown core and on retail corridors in surrounding municipalities. Organized operations targeting pharmacies, liquor stores, and electronics retailers are well-documented.
Toronto, Ontario sees commercial break-in activity distributed across its large and diverse retail base, with elevated risk in 24-hour corridors and areas with high tourism and retail density.
Calgary, Alberta has seen rising commercial property crime tracking economic pressures in the region.
Urban Versus Suburban Risk
While urban areas generate the highest absolute numbers of commercial break-ins, suburban and exurban businesses are not immune. Suburban strip malls, standalone retail buildings, and industrial parks often present fewer natural surveillance opportunities, fewer pedestrians, lower overnight activity making them attractive for criminals who prefer less-watched environments.
How Security Systems Reduce Break-In Risk
No single security measure eliminates break-in risk entirely. The most effective protection comes from layering multiple systems, each addressing a different phase of the criminal’s decision-making process: reconnaissance, approach, entry, and exit.
Security Cameras
Effectiveness: High for post-incident investigation, moderate as a real-time deterrent.
Visible cameras deter some opportunistic criminals. However, determined or organized criminals often operate with awareness of camera placement, working around coverage gaps or wearing concealment. Cameras document events but do not prevent entry.
Limitations: Cameras do not stop a break-in in progress. Resolution and storage quality affect evidentiary value.
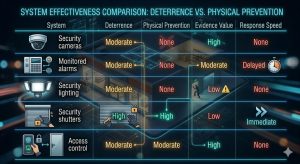
Monitored Alarm Systems
Effectiveness: Moderate to high when integrated with rapid-response protocols.
Monitored alarms create a response window, but the effectiveness depends entirely on response time. In many jurisdictions, police response to triggered commercial alarms averages 10 to 30 minutes. A smash-and-grab operation is complete in under two minutes.
Limitations: High false alarm rates have led many police departments to adopt verified response policies, further increasing actual response times. Alarm systems without physical barriers allow entry before any response arrives.
Security Lighting
Effectiveness: Moderate deterrent for opportunistic crime.
Well-lit exteriors reduce the appeal of a location for criminals who depend on darkness. Motion-activated lighting adds an element of surprise. Lighting is a low-cost, foundational deterrent measure.
Limitations: Lighting alone does not prevent entry. It is most effective when combined with other systems.
Security Shutters
Effectiveness: High for preventing and delaying entry, particularly against smash-and-grab.
Physical barriers that close over storefront openings, roll shutters, security shutters, and similar systems, address the fundamental vulnerability that most other systems ignore: the glass itself. A closed security shutter converts a breakable glass opening into a heavy-gauge steel or aluminum barrier that requires significant time, noise, and effort to defeat.
Limitations: Must be deployed (closed) to be effective. Does not address all entry points if only installed on primary openings.
Access Control Systems
Effectiveness: High for managing authorized entry and creating audit trails.
Electronic access control, keypad, fob, or biometric entry, limits who can enter and when, and creates records of access events. Most effective for preventing insider threats and managing multi-tenant facilities.
Limitations: Does not address forced entry by unauthorized individuals who bypass the access point entirely.
The data consistently supports a layered approach: cameras and alarms for detection and documentation, lighting and signage for deterrence, and physical barriers for actual prevention.
Why Security Shutters Are One of the Most Effective Protection Solutions
The core logic of physical security is simple: a criminal will abandon an attempt if the time, noise, or effort required exceeds their risk tolerance. Security shutters operate on this principle directly.
Physical Deterrence
A commercial property with closed security shutters presents a fundamentally different risk profile than one with exposed glass. The visual presence of a heavy-gauge shutter signals that forced entry will be time-consuming and loud, two factors that strongly deter opportunistic and smash-and-grab attacks.
Research on burglary deterrence consistently finds that criminals assess targets before committing. Properties that appear hardened are passed over in favor of easier alternatives. Security shutters function as a deterrence signal that is immediately visible during the reconnaissance phase.
Delay Time as the Critical Variable
The average smash-and-grab attack is completed in 60 to 90 seconds. Police response to a verified commercial alarm in an urban area averages 10 to 20 minutes. This gap, between the speed of criminal action and the speed of response, is where physical barriers create their value.
A quality security shutter, properly installed, cannot be defeated in under four to six minutes using hand tools. Defeating one with power tools takes longer still and generates significant noise and debris. This time requirement alone eliminates the smash-and-grab as a viable tactic against protected openings.
Visibility Reduction
Closed shutters eliminate visibility into the storefront, removing the ability to conduct visual reconnaissance of merchandise, cash handling, and internal layout from the street. This is particularly relevant for high-value retailers, convenience stores, and any business with visible merchandise or cash areas.
Damage Prevention
Even when a break-in attempt is unsuccessful, broken glass represents a significant cost: emergency board-up, glass replacement, and potential loss of business for the following day. Security shutters eliminate this cost entirely for protected openings, an unsuccessful entry attempt against a shutter leaves the glass behind it intact.
Application Scenarios
Scenario A: A small electronics retailer on a commercial strip installs security shutters on all storefront openings. A criminal group targeting the corridor assesses the property and moves to an unprotected neighboring store. The retailer experiences zero break-in attempts in the subsequent 18 months.
Scenario B: A pharmacy installs security shutters following a forced-entry break-in. A subsequent attempt is abandoned after several minutes when the attackers cannot defeat the shutter within their operational window. Police arrive and the property is undamaged.
Scenario C: A convenience store adds security shutters to its primary storefront. An insurance review results in a policy premium reduction reflecting the reduced risk profile of the physical barrier installation.
Commercial Break-In Prevention Checklist
Use this checklist as a starting point for assessing and improving your commercial property’s security posture. Not every measure applies to every business, but each addresses a documented vulnerability.
Physical Barrier Security
- Install security shutters on all primary glass storefront openings
- Install security shutters or reinforced protection on rear and side service doors
- Assess all ground-floor windows for vulnerability and install appropriate protection
- Evaluate vehicle ramming risk and install bollards or reinforced curbing if appropriate
- Ensure all exterior doors have reinforced frames and multi-point locking systems
- Audit roof access points and secure HVAC openings, skylights, and rooftop doors
Detection and Monitoring
- Install a monitored alarm system with verified response capability
- Position security cameras to cover all entry points, including rear and side access
- Eliminate camera blind spots, particularly in alleys and secondary entrances
- Install motion-activated lighting at all exterior entry points
- Ensure alarm system coverage extends to all perimeter entry points, not just primary entrances
Cash and Merchandise Protocols
- Minimize cash on premises overnight using a drop safe or end-of-day deposit protocol
- Store high-value merchandise away from primary display windows after hours
- Document inventory with photographs and serial numbers for insurance purposes
Operational Practices
- Train all employees to recognize and report suspicious reconnaissance behavior
- Establish a closing checklist that includes verification of all security systems
- Conduct a professional security assessment at least annually
- Review and update your commercial property insurance policy to reflect current protection measures
Community and Communication
- Coordinate with neighboring businesses on shared security concerns and camera coverage
- Participate in local business district security initiatives or Business Improvement Associations
- Maintain a relationship with your local commercial crime unit or community policing contact
Future Trends in Commercial Security
The commercial security landscape is evolving in response to both changing criminal tactics and advancing technology. Understanding where the industry is heading helps business owners make forward-looking investment decisions.
AI-Enabled Surveillance
Artificial intelligence applied to security camera feeds is moving from early adoption to mainstream deployment. AI surveillance systems can distinguish between normal activity and suspicious behavior patterns, flag perimeter probing in real time, and reduce the false positive rates that have plagued traditional motion-detection systems. For commercial properties, AI surveillance offers the potential for effective overnight monitoring without dedicated security staff.
Remote Monitoring Services
The remote monitoring model, where a central operations center actively watches live camera feeds for commercial clients, is growing rapidly. Unlike traditional alarm systems that only respond after an entry event, remote monitoring can identify suspicious activity during the reconnaissance phase and dispatch a response before entry is attempted.
Integrated Security Platforms
Increasingly, commercial security systems are moving toward unified platforms that combine access control, alarm monitoring, camera management, and physical barrier control in a single interface. Integrated platforms allow for more coherent security policies, for example, automatically engaging security shutters when the alarm system is armed at close of business.
Smart Physical Barriers
Security shutters and roll-down barriers are incorporating smart capabilities: remote operation via mobile applications, automated scheduling, integration with alarm systems, and status monitoring. A manager can verify that all shutters are engaged at close of business from a mobile device, and the system can alert them if a shutter has failed to close.
Predictive Risk Analytics
Insurance companies and security consultancies are increasingly applying data analytics to commercial crime risk assessment. Businesses that can demonstrate risk-reducing physical and technological security measures, with documentation, are better positioned to negotiate favorable insurance terms and to identify their highest-priority vulnerabilities based on local crime pattern data.
Organized Retail Crime Response
Law enforcement and the retail industry are developing more coordinated responses to organized retail crime. Dedicated ORC task forces operate in several states and provinces. Industry data sharing initiatives allow retailers to identify repeat criminal actors across multiple locations. For individual businesses, the practical implication is that participation in these information-sharing networks provides earlier warning of targeted criminal activity in their area.
Methodology
This report synthesizes information from the following categories of sources:
Primary Data Sources
FBI Uniform Crime Reporting (UCR) Program: The FBI UCR provides annual national-level crime data, including burglary offense counts broken down by property type (residential and non-residential). The most recent available full-year data has been used as the basis for US statistics cited in this report.
Statistics Canada Uniform Crime Reporting Survey: Statistics Canada publishes annual break-and-enter data categorized by residential and business premises, providing the foundation for Canadian statistics referenced here.
Insurance Industry Loss Data: Reports from major commercial property insurers and industry associations, including analyses published by the Insurance Bureau of Canada and the Insurance Information Institute (US), provide context for financial impact estimates.
Retail Crime Research: Studies published by the National Retail Federation (NRF), the Retail Council of Canada, and academic criminology research inform analysis of business-type targeting, criminal tactics, and prevention effectiveness.
Analytical Approach
Statistics presented in ranges reflect the variability in data across jurisdictions and reporting periods. Where exact current figures are unavailable, ranges are constructed from multiple source cross-references and are presented conservatively.
Regional and city-level analysis draws on publicly reported crime data, news reporting from business community publications, and local police service statistical releases.
Limitations
Underreporting: Commercial burglaries are significantly underreported. Businesses may not report incidents when losses fall below insurance deductibles, when they lack confidence in police response, or when they wish to avoid premium increases. All reported figures should be understood as floor estimates of actual incident rates.
Data lag: Crime statistics are typically published 12 to 18 months after the reference period. Trends described in this report reflect the most recently available data and may not capture the most current developments at time of reading.
Jurisdictional variation: Crime definitions, reporting methodologies, and data collection practices vary across US states and Canadian provinces, which limits direct cross-jurisdictional comparisons.
Effectiveness data: Security measure effectiveness is drawn from criminological research and industry studies, which vary in methodology and sample size. Effectiveness claims are presented as ranges and general findings rather than precise quantitative guarantees.
This report is published for educational and informational purposes. Statistics and estimates reflect available public data and research at time of preparation. Businesses should consult qualified security professionals and legal advisors for property-specific guidance.
© 2026 Talius. All rights reserved.